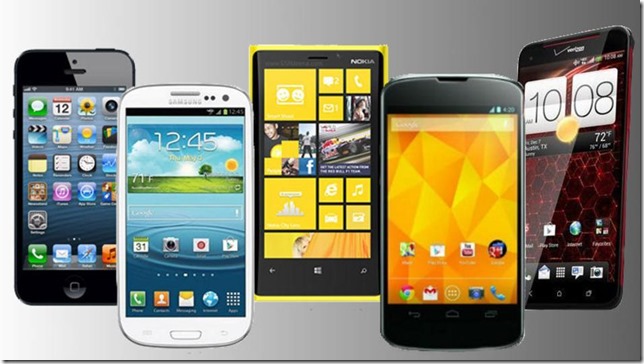
According to the new report by International Data Corporation (IDC), Samsung and Apple are currently the top manufacturers in the smartphone hierarchy right now, as before, but their lead has slid down notably in the last quarter.
Compared to same quarter of 2012, where both the manufacturers sold 32.2% and 16.6% of the smartphones worldwide, they topped out at only 30.4% and 13.1% this time around.
Sales increased though, obviously, topping out at 72.4 and 31.2 million units respectively, compared to 50.3 and 26 million of the year before.
HTC and Huawei dropped out from the top 5 manufacturers’ list altogether while Lenovo was a surprise entry in the list. The Chinese company sold 11.3 million units and attained a marketshare of 4.7%, unbelievably close to LG, which holds a marketshare of 5.1%.
Apple’s dropping sales were not unexpected, especially since a new leak of the so-called “budget iPhone” comes out almost everyday but in Samsung’s case, it does look awkward, curiously coming after the launch of the numerous versions of its Galaxy S4 flagship.
The overall smartphones sales were 237.9 million units. The case for Nokia shouldn’t be dissimilar from Apple, since this was the time period when it launched its Lumia 1020 flagship.
Top Five Smartphone Vendors, Shipments, and Market Share, 2013 Q2 (Units in Millions)
| Vendor |
2Q13 Unit Shipments
|
2Q13 Market Share
|
2Q12 Unit Shipments
|
2Q12 Market Share
|
Year-over-year Change
|
| Samsung |
72.4
|
30.4%
|
50.3
|
32.2%
|
43.9%
|
| Apple |
31.2
|
13.1%
|
26.0
|
16.6%
|
20.0%
|
| LG |
12.1
|
5.1%
|
5.8
|
3.7%
|
108.6%
|
| Lenovo |
11.3
|
4.7%
|
4.9
|
3.1%
|
130.6%
|
| ZTE |
10.1
|
4.2%
|
6.4
|
4.1%
|
57.8%
|
| Others |
100.8
|
42.4%
|
62.8
|
40.2%
|
60.5%
|
| Total |
237.9
|
100.0%
|
156.2
|
100.0%
|
52.3%
|
Top Five Total (Feature+Smartphone) Mobile Phone Vendors, Shipments, and Market Share, 2013 Q2 (Units in Millions)
| Vendor |
2Q13 Unit Shipments
|
2Q13 Market Share
|
2Q12 Unit Shipments
|
2Q12 Market Share
|
Year-over-year Change
|
| Samsung |
113.4
|
26.2%
|
97.5
|
23.9%
|
16.3%
|
| Nokia |
61.1
|
14.1%
|
83.7
|
20.5%
|
-27.0%
|
| Apple |
31.2
|
7.2%
|
26.0
|
6.4%
|
20.0%
|
| LG |
16.2
|
3.7%
|
13.1
|
3.2%
|
23.7%
|
| ZTE |
15.0
|
3.5%
|
15.2
|
3.7%
|
-1.1%
|
| Others |
195.2
|
45.2%
|
172.2
|
42.2%
|
13.4%
|
| Total |
432.1
|
100.0%
|
407.7
|
100.0%
|
6.0%
|

